
At-A-Glance
The Nasdaq Composite fell 5.3%, while the S&P 500 declined 0.9% for the month. In contrast, the Dow Jones Industrial Average gained 1.8%, and the small-cap Russell 2000 finished 0.6% higher.
All three major U.S. indices remained positive year to date (YTD). The S&P 500 led with an 11.8% gain, followed by the Nasdaq Composite (+10.0%) and the Dow Jones Industrial Average (+9.1%). The small-cap Russell 2000 Index is up 14.4% YTD.
The Bloomberg Commodity Index edged 0.1% lower in October but remained up 32.8% YTD.
Gold futures fell 6.9% in October to $3,898.50 per troy ounce, extending their year-to-date decline to 13.4%.
U.S. West Texas Intermediate crude oil futures surged 16.9% in October, finishing at $104.12 per barrel. Driven by the ongoing conflict with Iran, WTI crude has risen 117.0% YTD.
Market Indices
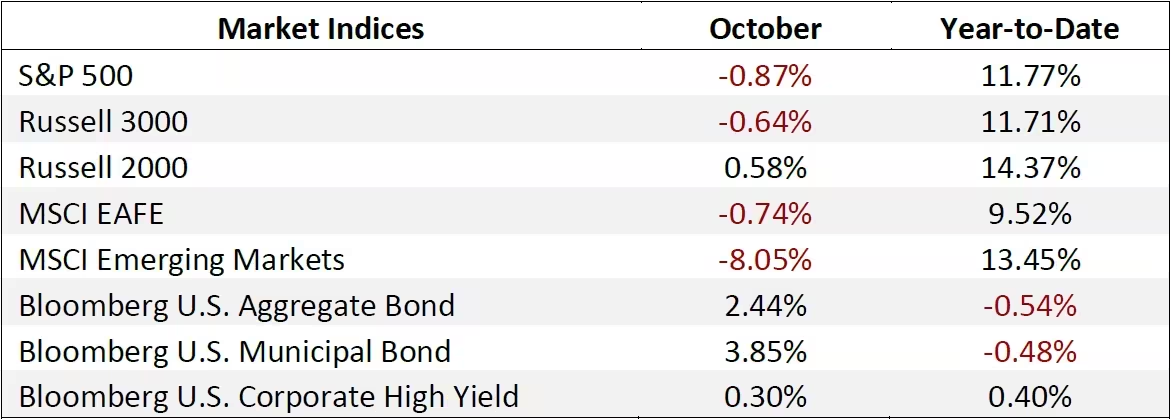
FactSet (all equity performance is total return, which includes dividends).
October was volatile for equities. Both the tech-heavy Nasdaq Composite and the S&P 500 reached new all-time highs but closing the month well below their peaks, while the Dow Jones Industrial Average posted a monthly gain.
Geopolitical tensions escalated as the Houthis targeted Saudi Arabia's oil infrastructure and Ukraine continued attacking Russian energy assets, pushing crude prices higher. Although reports suggest that oil flows through the region have reportedly recovered to pre-war levels, higher shipping costs through the Strait of Hormuz and strained inventories have kept energy prices elevated.
The economy added 29,000 jobs in September, while the prior two months were revised down by 60,000. Both CPI (Consumer Price Index) and PPI (Producer Price Index) inflation advanced higher, largely due to higher energy prices. At its late-October meeting, the Fed held rates steady in a 10-2 vote and left the door open to another hike in December.
Treasury yields extended their September climb before reversing mid-month as concerns surrounding the AI trade triggered a risk-off move. Investors questioned whether higher rates could restrict funding for capital-intensive AI data centers and whether returns would justify the scale of investment. Those concerns intensified later in the month as companies announced additional capital raises to fund next year’s spending plans.
The S&P 500 entered earnings season with high expectations, as analysts projected Q3 earnings growth of 28.6% and Q4 growth of 26.7%. With more than 60% of companies having reported, Q3 growth has improved to 30.1%, while Q4 estimates have risen to 28.0%. Despite these upgrades, positive surprises have drawn muted reactions, while misses have been punished.
Consistent with the risk-off environment, value stocks led performance in October. The Russell 1000 Value Index gained 4.4%, while the Russell 1000 Growth Index fell 6.1%. The 10.5-percentage-point gap marked value’s widest monthly outperformance since February 2001. Mid-caps also moved higher, with the Russell Midcap Index gaining 3.2% in October, as lower bond yields provided a tailwind for Mid Cap companies that rely more heavily on borrowing to fund expansion.
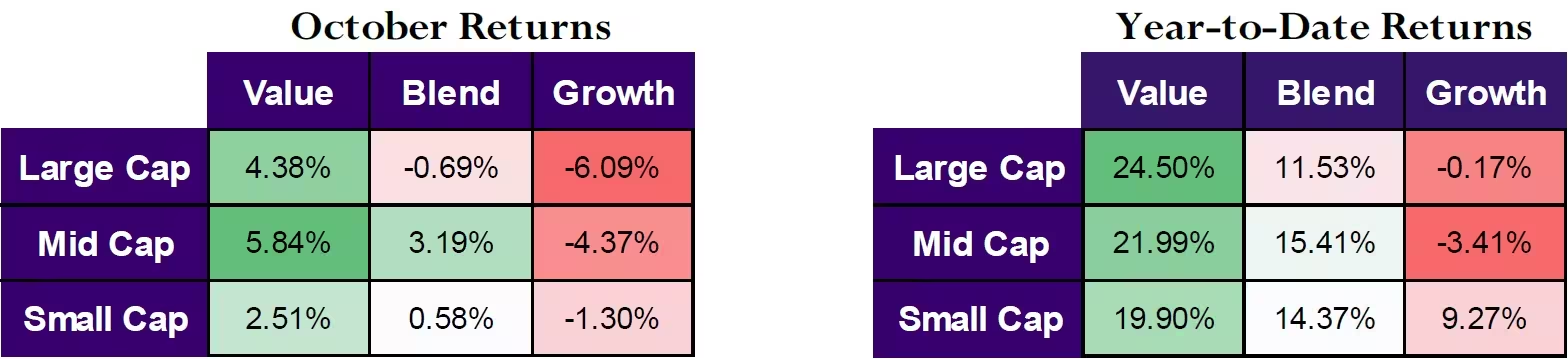
Source: Cetera Investment Management, FactSet, FTSE Russell. Returns shown are total return, which includes dividends. Investors cannot invest directly in indexes. Data as of 10/31/2026.
Nine of the 11 sectors finished higher in October, led by Energy (+14.0%). Consumer Staples (+11.6%) and Utilities (10.2%) also posted double-digit gains, consistent with the broader risk-off trade. Communication Services (-15.1%) and Information Technology (-6.8%) were the biggest laggards amid concerns surrounding the AI theme.
Year to date, Energy continued its strong rally, gaining 59.9%. Health Care (+21.0%) and Information Technology (+19.7%) have also performed well, while Communication Services (-11.3%) and Consumer Discretionary (-2.1%) are the biggest laggards.
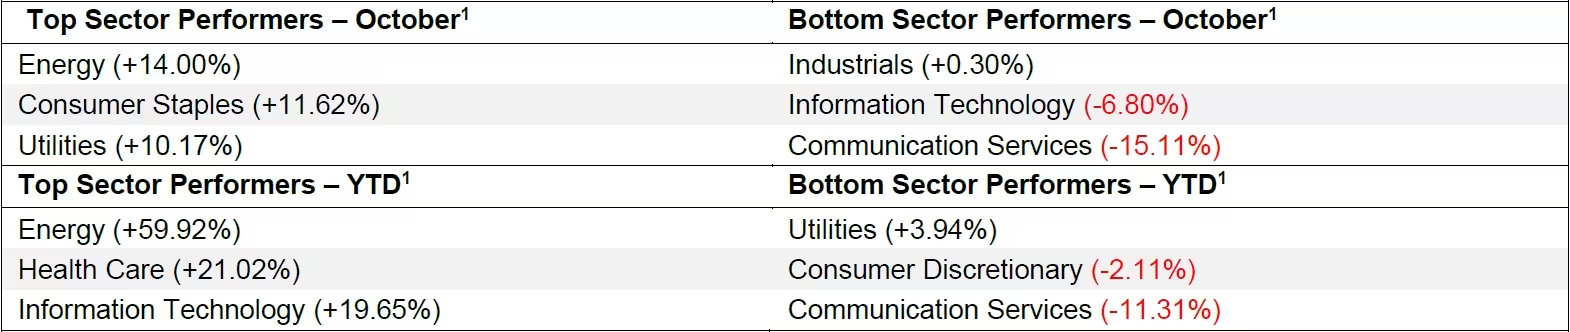
FactSet (all S&P 500 sector performance percentages are total return based, which include dividends).
Foreign markets were mixed in October. Developed-market equities, as measured by the MSCI EAFE Index, declined 0.7%, broadly mirroring U.S. market performance. The MSCI Emerging Markets Index fell 8.1%, underperforming both the S&P 500 and MSCI EAFE by roughly seven percentage points. South Korea (-15.6%) and Taiwan (-8.4%) declined amid the AI-related sell-off, given their significant exposure to semiconductor manufacturing. Brazil fell 12.0% following a surprise election result, while Mexico gained 4.6%.
Turning to fixed income, the 10-year and 30-year U.S. Treasury yields reversed course mid-month after reaching levels last seen in 2001. As bond prices move inversely to yields, the Bloomberg U.S. Government Bond Index gained 2.4% in October but remained down 0.5% year to date.
Investment-grade bonds, as measured by the Bloomberg U.S. Aggregate Bond Index, also gained 2.4% in October. The Bloomberg U.S. Corporate High Yield Bond Index edged up 0.3%, while municipal bonds outperformed Treasurys, with the Bloomberg U.S. Municipal Bond Index gaining 3.9%.
This report is created by Cetera Investment Management LLC.
Share


About Cetera® Investment Management
Cetera Investment Management LLC (CIM) is a Securities and Exchange Commission registered investment adviser owned by Cetera Financial Group® (CFG). CIM provides market perspectives, portfolio guidance, model management, and other investment advice to its affiliated broker-dealers and registered investment advisers.
About Cetera Financial Group
Cetera Financial Group (Cetera) is a network of independent retail firms, including those that are members of FINRA/SIPC: Cetera Advisors LLC; Cetera Wealth Services, LLC (formerly known as Cetera Advisor Networks); Cetera Investment Services LLC (marketed as Cetera Financial Institutions or Cetera Investors); and Cetera Financial Specialists LLC. Entities registered as investment advisers with the Securities and Exchange Commission include Cetera Investment Management LLC and Cetera Investment Advisers LLC. Cetera’s principal office is located at 655 W. Broadway, 11th Floor, San Diego, CA 92101.
Cetera Planning Partners (“CPP”), a registered investment adviser within the Aretec Group, Inc. (dba Cetera Holdings, an affiliate of Cetera). All of the referenced entities are under common ownership.
Advisory services may only be offered by investment adviser representatives in connection with an appropriate Advisory Services Agreement and disclosure brochure.
The material contained in this document was authored by and is the property of CIM. CIM provides investment management and advisory services to a number of programs sponsored by affiliated and non-affiliated registered investment advisers. Your registered representative and/or investment adviser representative is not registered with CIM and did not take part in the creation of this material. They may not be able to offer CIM portfolio management services.
Nothing in this presentation should be construed as offering or disseminating specific advice to any individual without the benefit of direct and specific consultation with a financial professional. Information contained herein shall not constitute an offer or a solicitation of any services. Past performance is not a guarantee of future results.
For more information about CIM, please reference the CIM Form ADV 2A and the applicable ADV 2A for the registered investment adviser your financial professional is registered with. Please consult with your financial professional for their specific firm registrations and available program offerings.
No independent analysis has been performed and the material should not be construed as investment advice. Investment decisions should not be based on this material since the information contained here is a singular update, and prudent investment decisions require the analysis of a much broader collection of facts and context. All information is believed to be from reliable sources; however, we make no representation as to its completeness or accuracy. The opinions expressed are as of the date published and may change without notice. Any forward-looking statements are based on assumptions, may not materialize, and are subject to revision.
All economic and performance information is historical and not indicative of future results. The market indices discussed are not actively managed. Investors cannot directly invest in unmanaged indices.
Please consult your financial professional for more information. Additional risks are associated with international investing, such as currency fluctuations, political and economic instability, and differences in accounting standards. A diversified portfolio does not assure a profit or protect against loss.