
Markets Near Record Highs as Yields Rise
Economic Data Offers Bonds Little Relief
Yields continued to move higher, with the 10-year U.S. Treasury yield reaching levels last seen in 2002, as the prolonged conflict in the Middle East kept oil prices and inflation concerns elevated. On the economic front, nonfarm payrolls came in well below an already elevated consensus estimate. The Fed’s preferred inflation gauge, headline PCE, held at 3.4% year over year in August, unchanged from July. However, a new methodology is estimated to have lowered the reading by 0.2 to 0.3 percentage points compared with the previous approach.
For the Week
The Nasdaq Composite reached a new high on Friday but failed to hold on until the closing bell, ending the week 0.5% higher. In contrast, the S&P 500 and Dow Jones Industrial Average fell 0.3% and 1.3%, respectively. The Russell 2000 index of small-cap stocks finished 0.1% lower. Internationally, developed and emerging markets lost 1.5% and 1.2%, respectively.
Core PCE Shows Signs of Stabilization
Core PCE inflation (Fed’s preferred gauge) rose 0.25% month-over-month in August, below expectations (+0.3%), and the annual rate held at +3.0%. Over the past 3 months, core PCE inflation has risen at an annualized pace of just 2.0%, in line with the Fed’s target.
Weekly Sector Insights
Three of the 11 sectors were up this week. Information Technology (+1.5%) and Energy (+1.4%) ended the week higher. Healthcare (2.7%) and Financials (-2.5%) were this week’s biggest draggers.
Treasury Yields Rise
The yield on the 10-year Treasury notes continued its upward momentum, closing the week at 5.28%. U.S. WTI crude oil fell 1.4%. Gold was down 3.7%.
The Week Ahead
Yields and Middle East negotiations will remain in focus. While earnings season officially begins next week, a major consumer staples and an airline company will report late this week. Revenue and guidance will be closely watched to gauge how consumers are navigating inflation.
Market Watch
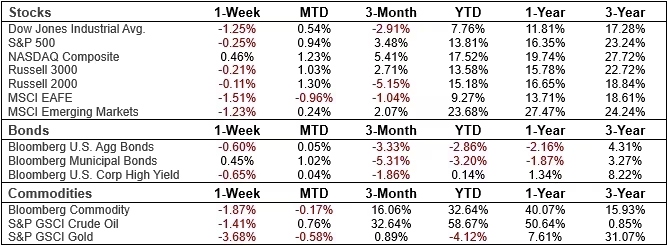
Source: Cetera Investment Management, FactSet. Total returns used, which includes dividends and interest.
Chart of the Week: September Hiring Loses Momentum
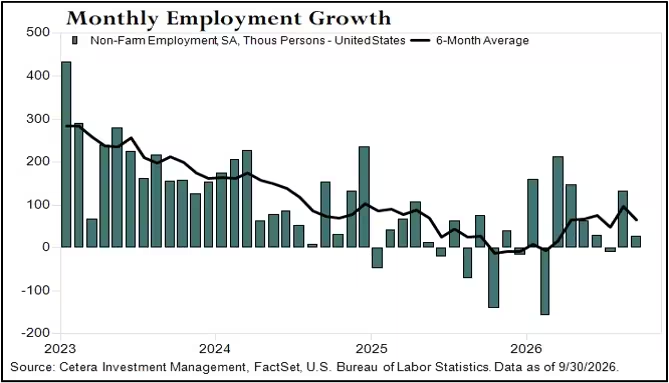
Source: Cetera Investment Management, FactSet, U.S. Bureau of Labor Statistics. Data as of 9/30/2026.
September payrolls rose by +29,000, missing expectations of +90,000. The prior two months were revised downward by 60,000, pushing July’s reading to -10,000. The unemployment rate edged up higher from 4.1% to 4.2% while participation rate inched higher from 61.6 to 61.8%, partly reflecting a growing workforce. Jobs in healthcare (+17,000) rose the most while government employment fell by 17,000.
Did You Know?
Q3 2026 S&P 500 earnings are expected to grow 29.5%, marking the third straight quarter above 25% and the eighth consecutive quarter of double-digit growth.
Economic Calendar
Monday, October 5
ISM Services PMI.
Tuesday, October 6
Import-Export Balance.
Wednesday, October 7
Mortgage Applications, FOMC September Meeting Minutes.
Thursday, October 8
Jobless Claims.
Friday, October 9
Michigan Consumer Sentiment.
This report is created by Cetera Investment Management LLC.
Share


About Cetera® Investment Management
Cetera Investment Management LLC (CIM) is a Securities and Exchange Commission registered investment adviser owned by Cetera Financial Group® (CFG). CIM provides market perspectives, portfolio guidance, model management, and other investment advice to its affiliated broker-dealers and registered investment advisers.
About Cetera Financial Group
Cetera Financial Group (Cetera) is a network of independent retail firms, including those that are members of FINRA/SIPC: Cetera Advisors LLC; Cetera Wealth Services, LLC (formerly known as Cetera Advisor Networks); Cetera Investment Services LLC (marketed as Cetera Financial Institutions or Cetera Investors); and Cetera Financial Specialists LLC. Entities registered as investment advisers with the Securities and Exchange Commission include Cetera Investment Management LLC and Cetera Investment Advisers LLC. Cetera’s principal office is located at 655 W. Broadway, 11th Floor, San Diego, CA 92101.
Avantax Planning Partners, Inc. (APP) and The Retirement Planning Group, LLC (“TRPG”), are both SEC registered investment advisers within the Aretec Group, Inc. (dba Cetera Holdings, an affiliate of Cetera). Cetera Planning Partners (“CPP”) operates as a doing business as name of TRPG. TRPG and APP currently operate independently. All of the referenced entities are under common ownership.
Disclosures
Advisory services may only be offered by investment adviser representatives in connection with an appropriate Advisory Services Agreement and disclosure brochure.
The material contained in this document was authored by and is the property of CIM. CIM provides investment management and advisory services to a number of programs sponsored by affiliated and non-affiliated registered investment advisers. Your registered representative and/or investment adviser representative is not registered with CIM and did not take part in the creation of this material. They may not be able to offer CIM portfolio management services.
Nothing in this presentation should be construed as offering or disseminating specific advice to any individual without the benefit of direct and specific consultation with a
financial professional. Information contained herein shall not constitute an offer or a solicitation of any services. Past performance is not a guarantee of future results.
For more information about CIM, please reference the CIM Form ADV 2A and the applicable ADV 2A for the registered investment adviser your financial professional is registered with. Please consult with your financial professional for their specific firm registrations and available program offerings.
No independent analysis has been performed and the material should not be construed as investment advice. Investment decisions should not be based on this material since the information contained here is a singular update, and prudent investment decisions require the analysis of a much broader collection of facts and context. All information is believed to be from reliable sources; however, we make no representation as to its completeness or accuracy. The opinions expressed are as of the date published and may change without notice. Any forward-looking statements are based on assumptions, may not materialize, and are subject to revision.
All economic and performance information is historical and not indicative of future results. The market indices discussed are not actively managed. Investors cannot directly invest in unmanaged indices. Please consult your financial professional for more information.
Additional risks are associated with international investing, such as currency fluctuations, political and economic instability, and differences in accounting standards. A diversified portfolio does not assure a profit or protect against loss.
Glossary
The Dow Jones Industrial Average is a price-weighted average of 30 significant stocks traded on the New York Stock Exchange and the NASDAQ.
The S&P 500 is an index of 500 stocks chosen for market size, liquidity and industry grouping (among other factors) designed to be a leading indicator of U.S. equities and is meant to reflect the risk/return characteristics of the large cap universe.
The NASDAQ Composite Index includes all domestic and international based common type stocks listed on The NASDAQ Stock Market. The NASDAQ Composite Index is a broad based index.
The Russell 2000 Index measures the performance of the small-cap segment of the U.S. equity universe and is a subset of the Russell 3000 Index representing approximately 10% of the total market capitalization of that index. It includes approximately 2000 of the smallest securities based on a combination of their market cap and current index membership.
The Russell 3000 Index measures the performance of the largest 3,000 U.S. companies representing approximately 98% of the investable U.S. equity market.
The Russell Midcap Index measures the performance of the mid-cap segment of the U.S. equity universe and is a subset of the Russell 1000 Index. It includes approximately 800 of the smallest securities based on a combination of their market cap and current index membership.
The Bloomberg US Aggregate Bond Index, which was originally called the Lehman Aggregate Bond Index, is a broad based flagship benchmark that measures the investment grade, US dollar-denominated, fixed-rate taxable bond market. The index includes Treasuries, government–related and corporate debt securities, MBS (agency fixed-rate and hybrid ARM pass-throughs), ABS and CMBS (agency and non-agency) debt securities that are rated at least Baa3 by Moody’s and BBB- by S&P. Taxable municipals, including Build America bonds and a small amount of foreign bonds traded in U.S. markets are also included. Eligible bonds must have at least one year until final maturity, but in practice the index holdings have a fluctuating average life of around 8.25 years.
The Bloomberg US Corporate High Yield Index measures the USD-denominated, non-investment grade, fixed-rate, taxable corporate bond market. Securities are classified as high yield if the middle rating of Moody's, Fitch, and S&P is Ba1/BB+/BB+ or below, excluding emerging market debt. Payment-in-kind and bonds with predetermined step-up coupon provisions are also included. Eligible securities must have at least one year until final maturity, but in practice the index holdings has a fluctuating average life of around 6.3 years.
The Bloomberg US Municipal Bond Index covers the USD-denominated long-term tax exempt bond market. The index has four main sectors: state and local general obligation bonds, revenue bonds, insured bonds, and prerefunded bonds. Eligible securities must be rated investment grade (Baa3/BBB- or higher) by Moody’s and S&P and have at least one year until final maturity.
The MSCI EAFE Index is designed to measure the equity market performance of developed markets (Europe, Australasia, Far East) excluding the U.S. and Canada. The Index is market-capitalization weighted.
The MSCI Emerging Markets Index is designed to measure equity market performance in global emerging markets. It is a float-adjusted market capitalization index.
The Bloomberg Commodity Index is a broadly diversified index that measures 22 exchange-traded futures on physical commodities in five groups (energy, agriculture, industrial metals, precious metals, and livestock), which are weighted to account for economic significance and market liquidity. No single commodity can comprise less than 2% or more than 15% of the index; and no group can represent more than 33% of the index.
The S&P GSCI Crude Oil Index is a sub-index of the S&P GSCI, provides investors with a reliable and publicly available benchmark for investment performance in the crude oil market.
The S&P GSCI Gold Index, a sub-index of the S&P GSCI, provides investors with a reliable and publicly available benchmark tracking the COMEX gold futures market.
The U.S. Dollar Index is a weighted geometric mean that provides a value measure of the United States dollar relative to a basket of major foreign currencies. The index, often carrying a USDX or DXY moniker, started in March 1973, beginning with a value of the U.S. Dollar Index at 100.000.